气象因素对二氧化碳和甲烷通量影响的研究:阿拉斯加北极苔原案例

CARVE: L1 In-situ Carbon and CH4 Flux and Meteorology at EC Towers, Alaska, 2011-2015
简介
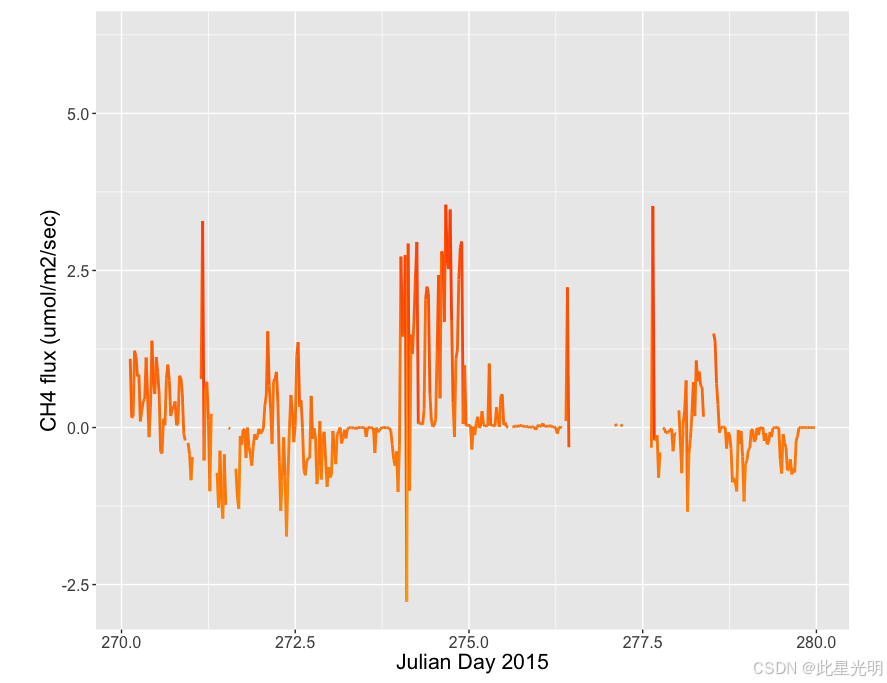
该数据集提供了位于阿拉斯加北极苔原的三个涡流协方差塔站的固定仪器的地面原位通量和气象科学数据。2011 年至 2015 年间,除了标准气象和环境变量外,每半小时报告一次位于阿拉斯加阿特卡苏克、巴罗和伊沃图克站点的二氧化碳、甲烷、水蒸气和潜能通量的真实和空白观测数据。这三个站点在阿拉斯加北坡形成了一个 300 公里的南北横断面,每个站点代表不同的北极植被群落。这些塔式测量创建了地球上最大、最不稳定的碳储量之一的长期记录。这些塔式观测数据用于确定二氧化碳和甲烷通量的季节和年际模式,以及它们与环境因素变化的关系。
摘要
Table 1. Column headers, description, units, and instrument from Atqasuk (ATQ), Barrow (BRW), and Ivotuk (IVO) eddy covariance towers.
Note: Quality flags are: 0 = observation value; 1 = interpolated value
| Column Header | Description | Units | Instrument |
| BP | Barometric pressure | mbar/10 | CS106 |
| CH4_Flux_7700 | CH4 flux | umol m-2 s-1 | LI-7700 |
| CH4_Flux_gf_7700 | Gap-filled CH4 flux | umol m-2 s-1 | LI-7700 |
| CH4_q_7700 | Quality flag | * | |
| CH4_Flux_LGR | CH4 flux | umol m-2 s-1 | LGR FGGA |
| CH4_Flux_gf_LGR | Gap-filled CH4 flux | umol m-2 s-1 | LGR FGGA |
| CH4_q_LGR | Quality flag | * | |
| CO2_Flux_7200 | CO2 flux | umol m-2 s-1 | LI-7200 |
| CO2_Flux_gf_7200 | Gap-filled CO2 flux | umol m-2 s-1 | LI-7200 |
| CO2_q_7200 | Quality flag | ** | |
| CO2_Flux_LGR | CO2 flux | umol m-2 s-1 | LGR FGGA |
| CO2_Flux_gf_LGR | Gap-filled CO2 flux | umol m-2 s-1 | LGR FGGA |
| CO2_q_LGR | Quality flag | ** | |
| Date | Date | yyyy-mm-dd HH:MM | |
| Day | Day of year and decimal hour | DOY.H | |
| Dsnow | Snow depth | m | SR50a |
| ER_7200 | Ecosystem respiration | umol m-2 s-1 | LI-7200 |
| ER_LGR | Ecosystem respiration | umol m-2 s-1 | LGR FGGA |
| G_1 | Ground heat flux profile 1 | Wm-2 | HFT3 |
| G_2 | Ground heat flux profile 2 | Wm-2 | HFT3 |
| G_3 | Ground heat flux profile 3 | Wm-2 | HFT3 |
| G_4 | Ground heat flux profile 4 | Wm-2 | HFT3 |
| Global_radiation | Solar radiation | Wm-2 | Delta T v3 |
| GPP_7200 | Gross primary production | umol m-2 s-1 | LI-7200 |
| GPP_LGR | Gross primary production | umol m-2 s-1 | LGR FGGA |
| H_7200 | Sensible heat flux | Wm-2 | CSAT-3 |
| H_LGR | Sensible heat flux | Wm-2 | CSAT-3 |
| H2O_Flux_7200 | H2O flux | umol m-2 s-1 | LI-7200 |
| H2O_Flux_LGR | H2O flux | umol m-2 s-1 | LGR FGGA |
| H2O_Flux_gf_LGR | Gap-filled H2O flux | umol m-2 s-1 | LGR FGGA |
| H2O_q_LGR | Quality flag | ** | |
| LE_Flux_7200 | Latent energy flux | Wm-2 | LI-7200 |
| LE_Flux_gf_7200 | Gap-filled latent energy flux | Wm-2 | LI-7200 |
| LE_Flux_q_7200 | Quality flag | ** | |
| LE_LGR | Latent energy flux | Wm-2 | LGR FGGA |
| LE_Flux_gf_LGR | Gap-filled latent energy flux | Wm-2 | LGR FGGA |
| LE_q_LGR | Quality flag | ** | |
| NEE_7200 | Net ecosystem exchange | g m-2 s-1 | LI-7200 |
| NEE_LGR | Net ecosystem exchange | g m-2 s-1 | LGR FGGA |
| P1_SWC_5 | Soil moisture at -5cm, profile 1 | VWC | CS616 |
| P1_SWC_10 | Soil moisture at -10cm, profile 1 | VWC | CS616 |
| P1_SWC_15 | Soil moisture at -15cm, profile 1 | VWC | CS616 |
| P1_SWC_20 | Soil moisture at -20cm, profile 1 | VWC | CS616 |
| P1_SWC_30 | Soil moisture at -30cm, profile 1 | VWC | CS616 |
| P2_SWC_5 | Soil moisture at -5cm, profile 2 | VWC | CS616 |
| P2_SWC_10 | Soil moisture at -10cm, profile 2 | VWC | CS616 |
| P2_SWC_15 | Soil moisture at -15cm, profile 2 | VWC | CS616 |
| P2_SWC_20 | Soil moisture at -20cm, profile 2 | VWC | CS616 |
| P2_SWC_30 | Soil moisture at -30cm, profile 2 | VWC | CS616 |
| P3_SWC_5 | Soil moisture at -5cm, profile 3 | VWC | CS616 |
| P3_SWC_15 | Soil moisture at -15cm, profile 3 | VWC | CS616 |
| P3_SWC_30 | Soil moisture at -30cm, profile 3 | VWC | CS616 |
| PARdown | Photosynthetically active radiation incoming | µmols-1m-2 | LI-190SB |
| PARup | Photosynthetically active radiation outgoing | µmols-1m-2 | LI-190SB |
| PPT | Precipitation | mm | TE525WS |
| RH | Relative humidity | % | HMP-45c |
| Rnet | Net radiation | Wm-2 | REBS Q7 |
| Rsolar | Solar radiation | Wm-2 | CMP3 |
| SoilT1_Surf | Soil temperature at surface, profile 1 | C | Type E thermocouple |
| SoilT1_5 | Soil temperature at -5cm, profile 1 | C | Type E thermocouple |
| SoilT1_15 | Soil temperature at -15cm, profile 1 | C | Type E thermocouple |
| SoilT1_30 | Soil temperature at -30cm, profile 1 | C | Type E thermocouple |
| SoilT1_40 | Soil temperature at -40cm, profile 1 | C | Type E thermocouple |
| SoilT2_Surf | Soil temperature at surface, profile 2 | C | Type E thermocouple |
| SoilT2_5 | Soil temperature at -5cm, profile 2 | C | Type E thermocouple |
| SoilT2_15 | Soil temperature at -15cm, profile 2 | C | Type E thermocouple |
| SoilT2_30 | Soil temperature at -30cm, profile 2 | C | Type E thermocouple |
| SoilT2_40 | Soil temperature at -40cm, profile2 | C | Type E thermocouple |
| SoilT3_Surf | Soil temperature at surface, profile 3 | C | Type E thermocouple |
| SoilT3_5 | Soil temperature at -5cm, profile 3 | C | Type E thermocouple |
| SoilT3_15 | Soil temperature at -15cm, profile 3 | C | Type E thermocouple |
| SoilT3_30 | Soil temperature at -30cm, profile 3 | C | Type E thermocouple |
| SoilT3_40 | Soil temperature at -40cm, profile 3 | C | Type E thermocouple |
| SoilT4_Surf | Soil temperature at surface, profile 3 | C | Type E thermocouple |
| SoilT4_5 | Soil temperature at -5cm, profile 4 | C | Type E thermocouple |
| SoilT4_15 | Soil temperature at -15cm, profile 4 | C | Type E thermocouple |
| SoilT4_30 | Soil temperature at -30cm, profile 4 | C | Type E thermocouple |
| SoilT4_40 | Soil temperature at -40cm, profile 4 | C | Type E thermocouple |
| Tair | Air temperature | C | HMP-155A |
| Tsurf | Ground surface temperature | C | SI-111 |
| u*_7200 | Friction velocity | ms-1 | LI-7200 |
| u*_LGR | Friction velocity | ms-1 | LGR FGGA |
| WD | Wind direction, degrees from north | ° | Young 05103 |
| WS | Wind speed | ms-1 | Young 05103 |
* Gap filling done using methods described in Watts et al, 2014
代码
引用
Baldocchi, D.D., B. B. Hicks, and T. P. Meyers. 1988. Measuring biosphere-atmosphere exchanges of biologically related gases with micrometeorological methods. Ecology 69, 1331–1340.
Watts, J.D., J.S. Kimball, F.J.W. Parmentier, T. Sachs, J. Rinne, D. Zona, W. Oechel, T. Tagesson, M. Jackowicz-Korczynski, and M. Aurela. 2014. A satellite data driven biophysical modeling approach for estimating northern peatland and tundra CO2 and CH4 fluxes. Biogeosciences 11:1961-1980.

- 点赞
- 收藏
- 关注作者
评论(0)